A radically different problem-solving method
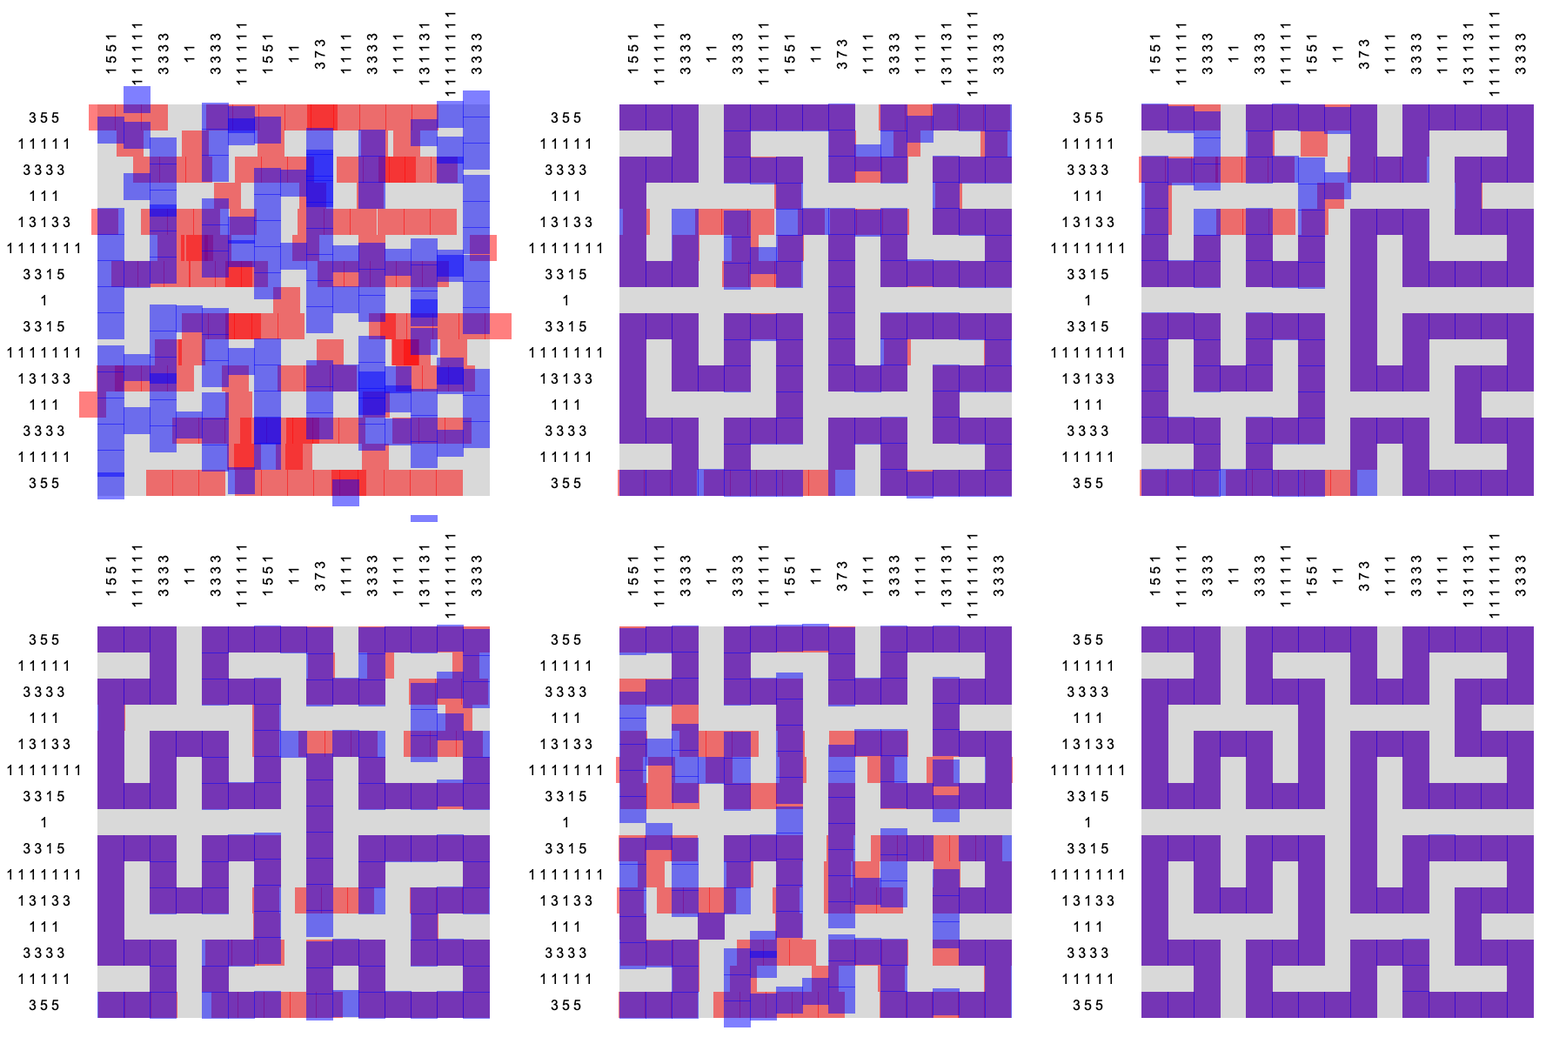
The animation running above shows a new kind of algorithm solving a nonogram puzzle. The task is to arrange purple squares in a grid according to some constraints listed on the sides. For example, the “3 5 5” next to the top row means the purple squares should form separated blocks of size 3, 5, and 5 in that row. The puzzle would be trivial to solve with only row-constraints. But there are constraints on the columns as well. After arranging all the rows, it better work out that the vertical stack of purple squares, in the first column, forms blocks of size 1, 5, 5, and 1, and so on.
The standard way most problems in science and industry are solved today has the following physical analogy: a ball rolling down a hill. The hill is a made-up landscape with the property that the lowest point reveals the solution to the problem. Whereas experts may debate the fine points of landscape-construction, or whether the ball’s motion should involve momentum, you certainly don’t need an animation to understand what the algorithm is doing. And while puzzles might not command as much respect as the training of neural networks, it's significant that function-minimizing methods cannot solve nonograms.
This book is about a completely different—though still very general—approach to solving problems. There is no ball moving along a downhill gradient, or even a function whose minimum defines the solution. To understand the idea behind what is going on instead, let’s start with the color purple.
The squares are rendered purple only after the solution (Hilbert’s space filling curve) is found. If you study the earlier frames of the animation you will notice that the algorithm is actually moving around two sets of squares, colored red and blue. The red squares move only horizontally—always respecting the row constraints—while the blue squares only move vertically while minding the column constraints. This strategy of decomposing problems into replicated sets of variables is called divide-and-concur, where “concur” refers to the fact that the algorithm also tries to get the “replicas” to agree. As you learned in second grade, when red is overlaid with blue, you get purple.
Fair warning: This book is not a spiritual guide for better problem solving. It is built on rigorous mathematics. And this promotion would be incomplete if it did not address the word “projection” that appears in the title. In a multi-dimensional space—the setting for both nonograms and neural networks—the projection PA takes an arbitrary point and moves it to the nearest point in set A. For nonograms, PA exactly and efficiently (in a distance minimizing sense) restores the row constraints on the red squares and the column constraints on the blue squares. There’s another projection, PB, that finds a distance minimizing matching, or concur, between the two sets of squares. The math behind projections is often very simple but can also be sophisticated. For example, to compute the concur projection for nonograms one needs to find a “minimum weight bipartite matching”.
In the new method, the projections PA and PB take the place of the gradient-descent moves in function minimization. The precise way these get combined in an iterative scheme to solve problems brings up some interesting history. I stumbled on the magic formula at a workshop about lensless microscopy, where it was being used to algorithmically “retrieve the phases” of light diffracted by an object, from just the intensity recorded on a detector. If this strikes you as impossible, a good part of the book tries to make this plausible. I only appreciated the generality of the method (the two sets A and B, their projections, the iterative algorithm) after my curiosity had led me to consider diverse applications, including puzzles.
If you think you are going to miss the decreasing cost/energy/loss in the function-minimizing approach, the new method has a nice replacement. The two projections give you a pair of points in each iteration, one in set A, the other in set B. If, as in the nonogram example, you’ve managed to formulate solutions to your problem as “find a point that is both in A and B”, then the distance between the pair of points tells you how close you are to finding the solution. The magic formula used in the iterative scheme has the general property that the two points stop moving exactly when they are the same point (and the distance between them is zero).
Here's what you'll find in the book: Chapter 1 covers the method’s origins, highlighting its features without getting into much detail. The second chapter is all about the “bipartisan” formulation of problems, where solutions lie in the intersection of two sets. Chapter 3 considers the size of the intersection of A with B, and why conspiracies that keep this from being the empty set are a good thing. In Chapter 4 you will learn to project to anything under the sun. Chapter 5 is the in-depth analysis of the iterative algorithm; using it in practice is covered in Chapter 6. This is followed by the longest chapter whose sections explore a diverse range of applications, most of them serious. The final chapter is my best effort at a cliffhanger ending.
I’m a physics professor at Cornell, where I mostly confront problems like explaining to undergraduates “what is temperature, really?” This book is a side project. But if you indulge me in one tiny conceit, I’m Prometheus bringing a new type of fire. Skeptical? Then pay close attention to the blue/purple square in the nonogram’s middle column, and how it makes seemingly deliberate moves—up, down, and back again. How does something built from “just projections” behave so intelligently?
Solving Problems with Projections
by Veit Elser
